Release 2 (8.1.6)
Part Number A76992-01
Library |
Product |
Contents |
Index |
| Oracle8i Designing and Tuning for Performance Release 2 (8.1.6) Part Number A76992-01 |
|
![]()
![]()
This chapter explains how to avoid input/output (I/O) bottlenecks that could prevent Oracle from performing at its maximum potential.
This chapter contains the following sections:
The performance of many software applications is inherently limited by disk input/output (I/O). Often, CPU activity must be suspended while I/O activity completes. Such an application is said to be I/O bound. Oracle is designed so that performance is not limited by I/O.
Tuning I/O can enhance performance if a disk containing database files is operating at its capacity. However, tuning I/O cannot help performance in CPU bound cases--or cases in which your computer's CPUs are operating at their capacity.
|
See Also:
It is important to tune I/O after following the recommendations presented in Chapter 19, "Tuning Memory Allocation". That chapter explains how to allocate memory so as to reduce I/O to a minimum. After reaching this minimum, follow the instructions in this chapter to achieve more efficient I/O performance. |
This section introduces I/O performance issues. It covers:
When designing a new system, you should analyze I/O needs from the top down, determining what resources you require in order to achieve the desired performance.
For an existing system, you should approach I/O tuning from the bottom up:
This section explains how to determine your system's I/O requirements.
To begin, figure out the number of reads and writes involved in each transaction, and distinguish the objects against which each operation is performed.
In an OLTP application, for example, each transaction might involve:
So, one transaction requires 2 reads and 1 write, all to different objects.
With this example, the designer might specify that 100 tps constitutes an acceptable level of performance. To achieve this, the system must be able to perform 300 I/Os per second:
To do this, ascertain the number of I/Os that each disk can perform per second. This number depends on three factors:
In general, disk speed tends to have the following characteristics:
| Disk Speed | File System | Raw Devices |
|
Reads per second |
fast |
slow |
|
Writes per second |
slow |
fast |
Table 20-2 Disk I/O Analysis Worksheet
| Disk Speed | File System | Raw Devices |
|
Reads per second |
|
|
|
Writes per second |
|
|
The disks in the current example have characteristics as shown in Table 20-3:
| Disk Speed | File System | Raw Devices |
|
Reads per second |
50 |
45 |
|
Writes per second |
20 |
50 |
Table 20-4 Disk I/O Requirements Worksheet
| Object | If Stored on File System | If Stored on Raw Devices | ||||
| R/W Needed per Sec. | Disk R/W Capabil. per Sec. | Disks Needed | R/W Needed per Sec. | Disk R/W Capabil. per Sec. | Disks Needed | |
|
A |
|
|
|
|
|
|
|
B |
|
|
|
|
|
|
|
C |
|
|
|
|
|
|
|
Disks Req'd |
|
|
|
|
||
Table 20-5 shows the values from this example:
This section explains the following:
Use the following approach to design file storage:
These steps are described in detail under the following headings.
Evaluate your application to determine how often it requires each type of I/O operation (sequential read, sequential write, random read, and random write).
Table 20-6 shows the types of read and write operations performed by each of the background processes, by foreground processes, and by parallel execution servers.
| Operation | Process | |||||||
| LGWR | DBWn | ARCH | SMON | PMON | CKPT | Foreground | PQ Processes | |
|
Sequential Read |
|
|
X |
X |
|
X |
X |
X |
|
Sequential Write |
X |
|
X |
|
|
X |
X |
X |
|
Random Read |
|
|
|
X |
|
|
X |
|
|
Random Write |
|
X |
|
|
|
|
|
|
In this discussion, a sample application might involve 50% random reads, 25% sequential reads, and 25% random writes.
Sequential I/O is characterized by high data rates. For example, a single DSS type I/O may access hundreds of blocks. Sequential access is efficient, because these accesses allow data prefetches and cause limited head positioning. This provides high throughputs.
Because DSS systems may not do a large number of transactions per second, it is better to estimate the size of the I/O in terms of bytes per second. For example:
(estimate # of physical blocks in transaction * Oracle block size) = byte/second
Using this value and the theoretical limits for disk and controller throughputs can help you determine the number of drives/controllers to implement.
The goal in optimizing sequential I/O is to maximize throughput by involving the maximum number of disks in the I/O request. The more disks involved, the greater aggregate throughput. For example:
4 disks/array @ 5Mb/second = (20 Mb/second)I/O call
Random I/O is characterized by high I/O rate in OLTP. It requires frequent seeks with small I/O sizes.
The following example determines the application load for OLTP (gets the number and size of the transactions):
(# of blocks accessed/transaction) * (# of transactions/second) = blocks/second
Using this value and the theoretical limits for disk and controller throughputs can help you determine the number of drives per controllers to implement.
The goal in optimizing random I/O is to reduce disk hot spots and limit seek times.
This section illustrates relative performance of read/write operations by a particular test system.
Table 20-7 shows the speed of sequential read in milliseconds per I/O on a test system.
Doing research like this helps determine the correct stripe size. In this example, it takes at most 5.3 milliseconds to read 16KB. If your data is in chunks of 256KB, then you could stripe the data over 16 disks (as described) and maintain this low read time.
By contrast, if all your data is on one disk, then read time would be 80 milliseconds. Thus, the test results show that on this particular set of disks, things look quite different from what might be expected. It is sometimes beneficial to have a smaller stripe size, depending on the size of the I/O.
Table 20-8 shows the speed of sequential write in milliseconds per I/O on the test system.
Table 20-9 shows the speed of random read in milliseconds per I/O on the test system.
Table 20-10 shows the speed of random write in milliseconds per I/O on the test system.
Knowing the types of operations that predominate in your application and the speed with which your system can process the corresponding I/Os, you can choose the disk layout that maximizes performance.
For example, with the sample application and test system described previously, the UNIX file system is a good choice. With random reads predominating (50% of all I/O operations), 8KB is good block size. Furthermore, the UNIX file system in this example processes sequential reads (25% of all I/O operations) almost twice as fast as raw devices, given an 8KB block size.
Table data in the database is stored in data blocks. This section describes how to allocate space within data blocks for best performance.
With single block I/O (random read), minimize the number of reads required to retrieve the desired data. How you store the data determines whether this performance objective is achieved. It depends on two factors: storage of the rows and block size.
Tests have proven that matching the database block size to the UNIX file system (UFS) block size provides the most predictable and efficient performance. On UNIX systems, the block size of an existing file system can be determined using the df -g command.
Having the database block size greater than the UFS block size, or having the UFS block size greater than database block size, may yield inconsistent performance based on how your operating system and external I/O subsystem manage data pre-fetching and the coalescing of multiple I/Os.
Figure 20-1 illustrates the suitability of various block sizes to online transaction processing (OLTP) or decision support (DSS) applications.

Table 20-11 lists the advantages and disadvantages of different block sizes.
The number of I/Os a disk can perform depends on whether the operations involve reading or writing to objects stored on raw devices or on the file system. This affects the number of disks you must use to achieve the desired level of performance.
When performing I/O tuning, remember that I/O service time reported by the operating system is not necessarily the total time taken to process the I/O. The goal of tuning I/O is to minimize waits, such that the response time equals service time plus wait time.
An I/O queue consists of two stages: one stage is in the device driver, and the second stage is in the device itself. When the I/O is waiting to be serviced by the SCSI bus or disk, it is actually waiting in the device driver queue. This is the true wait queue. The time on the wait queue is the wait queue time. When the I/O is truly being service by the disk unit, then it is on the active or run queue. The time to physically process the I/O is the service time.
The goal in tuning I/O is to minimize waits and increase throughput. Disk time can encounter the following bottlenecks:
This section explains the I/O path, so that you can analyze and tune I/O bottlenecks. The I/O path follows these steps:
The following table explains where the wait components lay with respect to the I/O path.
|
See Also:
For more information on removing I/O contention, see "Reducing Disk Contention by Distributing I/O". |
This section describes two tasks to perform if you suspect a problem with I/O usage:
Oracle compiles file I/O statistics that reflect disk access to database files. These statistics report only the I/O utilization of Oracle sessions--yet every process affects the available I/O resources. Tuning non-Oracle factors can thus improve performance.
Use operating system monitoring tools to determine what processes are running on the system as a whole, and to monitor disk access to all files. Remember that disks holding datafiles and redo log files may also hold files that are not related to Oracle. Try to reduce any heavy access to disks that contain database files. Access to non-Oracle files can be monitored only through operating system facilities rather than through the V$FILESTAT view.
Tools, such as sar -d, on many UNIX systems let you examine the I/O statistics for your entire system. (Some UNIX-based platforms have an iostat command.) On NT systems, use Performance Monitor.
This section identifies the views and processes that provide Oracle I/O statistics. It also shows how to check statistics using V$FILESTAT.
Table 20-12 shows dynamic performance views to check for I/O statistics relating to Oracle database files, log files, archive files, and control files.
Table 20-13 lists which file types processes write to.
| File | Process | |||||||
| LGWR | DBWn | ARCH | SMON | PMON | CKPT | Foreground | PQ Process | |
|
Database Files |
|
X |
|
X |
X |
X |
X |
X |
|
Log Files |
X |
|
|
|
|
|
|
|
|
Archive Files |
|
|
X |
|
|
|
|
|
|
Control Files |
X |
X |
X |
X |
X |
X |
X |
X |
V$SYSTEM_EVENT can be queried by event to show the total number of I/Os and average duration by type of I/O (read/write). With this, you can determine which types of I/O are too slow. If there are Oracle-related I/O problems, then tune them. But, if your process is not consuming the available I/O resources, then some other process is. Go back to the system to identify the process that is using up so much I/O, and determine why. Then tune this process.
Examine disk access to database files through the dynamic performance view V$FILESTAT. This view shows the following information for database I/O (but not for log file I/O):
By default, this view is available only to the user SYS and to users granted SELECT ANY TABLE system privilege, such as SYSTEM. The following column values reflect the number of disk accesses for each datafile:
PHYWRTS |
The number of writes to each database file. |
Use the following query to monitor these values over some period of time while your application is running:
SELECT NAME, PHYRDS, PHYWRTS
FROM V$DATAFILE df, V$FILESTAT fs
WHERE df.FILE# = fs.FILE#;
This query also retrieves the name of each datafile from the dynamic performance view V$DATAFILE. Sample output might look like this:
NAME                                             PHYRDS    PHYWRTS
-------------------------------------------- ---------- ----------
/oracle/ora70/dbs/ora_system.dbf                   7679       2735
/oracle/ora70/dbs/ora_temp.dbf                       32        546
The PHYRDS and PHYWRTS columns of V$FILESTAT can also be obtained through SNMP.
The total I/O for a single disk is the sum of PHYRDS and PHYWRTS for all the database files managed by the Oracle instance on that disk. Determine this value for each of your disks. Also, determine the rate at which I/O occurs for each disk by dividing the total I/O by the interval of time over which the statistics were collected.
The rest of this chapter describes various techniques of solving I/O problems:
This section describes how to reduce disk contention.
Disk contention occurs when multiple processes try to access the same disk simultaneously. Most disks have limits on both the number of accesses and the amount of data they can transfer per second. When these limits are reached, processes may have to wait to access the disk.
In general, consider the statistics in the V$FILESTAT view and your operating system facilities. Consult your hardware documentation to determine the limits on the capacity of your disks. Any disks operating at or near full capacity are potential sites for disk contention. For example, 60 or more I/Os per second may be excessive for some disks on VMS or UNIX operating systems.
In addition, review V$SESSION_EVENT for the following events: db file sequential read, db file scattered read, db file single write, and db file parallel write. These are all events corresponding to I/Os performed against the data file headers, control files, or data files. If any of these wait events correspond to high Average Time, then investigate the I/O contention using sar or iostat. Look for busy waits on the device. Examine the file statistics to determine which file is associated with the high I/O.
To reduce the activity on an overloaded disk, move one or more of its heavily accessed files to a less active disk. Apply this principle to each of your disks until they all have roughly the same amount of I/O. This is known as distributing I/O.
Oracle processes constantly access datafiles and redo log files. If these files are on common disks, then there is potential for disk contention. Place each datafile on a separate disk. Multiple processes can then access different files concurrently without disk contention.
Place each set of redo log files on a separate disk with no other activity. Redo log files are written by the Log Writer process (LGWR) when a transaction is committed. Information in a redo log file is written sequentially. This sequential writing can take place much faster if there is no concurrent activity on the same disk. Dedicating a separate disk to redo log files usually ensures that LGWR runs smoothly with no further tuning attention. Performance bottlenecks related to LGWR are rare.
|
See Also:
For information on tuning LGWR, see the section "Detecting Contention for Redo Log Buffer Latches". |
Dedicating separate disks to datafiles and mirroring redo log files are important safety precautions. These steps ensure that the datafiles and the redo log files cannot both be lost in a single disk failure. Mirroring redo log files ensures that a redo log file cannot be lost in a single disk failure.
In order to prevent I/O contention between the archiver process and LGWR (when using multi-membered groups), make sure that archiver reads and LGWR writes are separated. For example, if your system has 4 groups with 2 members, then the following scenario should used to separate disk access:
4 groups x 2 members each = 8 logfiles labeled: 1a, 1b, 2a, 2b, 3a, 3b, 4a, 4b.
This requires at least 4 disks, plus one disk for archived files.
Figure 20-2 illustrates how redo members should be distributed across disks to minimize contention.
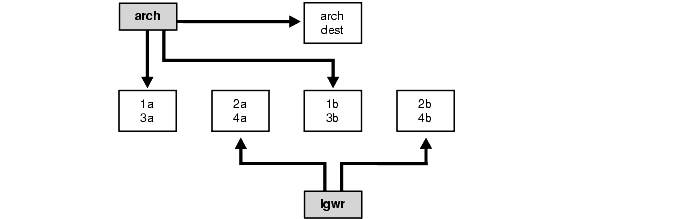
In this example, LGWR switched out of log group 1 (member 1a and 1b) and is now writing to log group2 (2a and 2b). Concurrently, the archiver process is reading from the group 1 and writing to its archive destination. Note how the redo log files are isolated from contention.
Striping, or spreading a large table's data across separate datafiles on separate disks, can also help to reduce contention.
It is not necessary to separate a frequently used table from its index. During the course of a transaction, the index is read first, and then the table is read. Because these I/Os occur sequentially, the table and index can be stored on the same disk without contention. However, for very high OLTP systems, separating indexes from tables may be required.
Split indexes and tables into separate tablespaces to minimize disk head movement and parallelize I/O. Both reads happen faster because one disk head is on the index data and the other is on the table data.
The idea of separating objects accessed simultaneously applies to indexes as well. For example, if a SQL statement uses two indexes at the same time, then performance is improved by having each index on a separate disk.
Also, avoid having several heavily accessed tables on the same disk. This requires strong knowledge of the application access patterns.
The use of partitioned tables and indexes can improve performance of operations in a data warehouse. Divide a large table or index into multiple physical segments residing in different tablespaces. All tables that contain large object datatypes should be placed into a separate tablespace as well.
If possible, eliminate I/O unrelated to Oracle on disks that contain database files. This measure is especially helpful in optimizing access to redo log files. Not only does this reduce disk contention, it also allows you to monitor all activity on such disks through the dynamic performance table V$FILESTAT.
This section describes:
Striping divides a large table's data into small portions and stores these portions in separate datafiles on separate disks. This permits multiple processes to access different portions of the table concurrently without disk contention. Striping is particularly helpful in optimizing random access to tables with many rows. Striping can either be done manually (described below), or through operating system striping utilities.
Benchmark tuners in the past tried hard to ensure that the I/O load was evenly balanced across the available devices. Currently, operating systems are providing the ability to stripe a heavily used container file across many physical devices. However, such techniques are productive only where the load redistribution eliminates or reduces some form of queue.
If the wait service time exists, along with high percentage busy on a drive, then I/O distribution may be required. Where larger numbers of physical drives are available, consider dedicating two drives to carrying redo logs (two because redo logs should always be mirrored either by the operating system or using Oracle redo log group features). Because redo logs are written serially, drives dedicated to redo log activity normally require limited head movement. This significantly accelerates log writing.
When archiving, it is beneficial to use extra disks so that LGWR and ARCH do not compete for the same read/write head. This is achieved by placing logs on alternating drives.
Mirroring can also be a cause of I/O bottlenecks. The process of writing to each mirror is normally done in parallel, and does not cause a bottleneck. However, if each mirror is striped differently, then the I/O is not completed until the slowest mirror member is finished. To avoid I/O problems, stripe using the same number of disks for the destination database, or the copy, as you used for the source database.
For example, if you have 160KB of data striped over 8 disks, but the data is mirrored onto only one disk, then regardless of how quickly the data is processed on the 8 disks, the I/O is not completed until 160KB has been written onto the mirror disk. It might thus take 20.48 milliseconds to write the database, but 137 milliseconds to write the mirror.
To stripe disks manually, you need to relate an object's storage requirements to its I/O requirements.
For example, if an object requires 5GB in Oracle storage space, then you need one 5GB disk or two 4GB disks to accommodate it. On the other hand, if the system is configured with 1GB or 2GB disks, then the object may require 5 or 3 disks, respectively.
For example, if the storage requirement is 5 disks (1GB each), and the I/O requirement is 2 disks, then your application requires the higher value: 5 disks.
CREATE TABLESPACE statement. Specify the datafiles in the DATAFILE clause. Each of the files should be on a different disk. For example:
CREATE TABLESPACE stripedtabspace
   DATAFILE 'file_on_disk_1' SIZE 1GB,
      'file_on_disk_2' SIZE 1GB,
      'file_on_disk_3' SIZE 1GB,
      'file_on_disk_4' SIZE 1GB,
      'file_on_disk_5' SIZE 1GB;
CREATE TABLE statement. Specify the newly created tablespace in the TABLESPACE clause.
Also specify the size of the table extents in the STORAGE clause. Store each extent in a separate datafile. The table extents should be slightly smaller than the datafiles in the tablespace to allow for overhead. For example, when preparing for datafiles of 1GB (1024MB), you can set the table extents to be 1023MB. For example:
CREATE TABLE stripedtab (
   col_1  NUMBER(2),
   col_2  VARCHAR2(10) )
   TABLESPACE stripedtabspace
   STORAGE ( INITIAL 1023MB  NEXT 1023MB
      MINEXTENTS 5  PCTINCREASE 0 );
(Alternatively, you can stripe a table by entering an ALTER TABLE ALLOCATE EXTENT statement with DATAFILE 'datafile' SIZE 'size'.)
These steps result in the creation of table STRIPEDTAB. STRIPEDTAB has 5 initial extents, each of size 1023MB. Each extent takes up one of the datafiles named in the DATAFILE clause of the CREATE TABLESPACE statement. Each of these files is on a separate disk. The 5 extents are all allocated immediately, because MINEXTENTS is 5.
|
See Also:
For more information on |
As an alternative to striping disks manually, use operating system utilities or third-party tools, such as logical volume managers, or use hardware-based striping.
With utilities or hardware-based striping mechanisms, the main factors to consider are stripe size, number of disks to stripe across (which defines the stripe width), and the level of concurrency (or level of I/O activity). These factors are affected by the Oracle block size and the database access methods.
| Concurrency | I/O Size | Typical Stripe Size |
|---|---|---|
|
Low |
Small |
k * DB_BLOCK_SIZE |
|
Low |
Large |
k * DB_BLOCK_SIZE |
|
High |
Small |
k * DB_BLOCK_SIZE |
|
High |
Large |
k * DB_BLOCK_SIZE * DB_FILE_MULTI_BLOCK_READ_COUNT |
Where k = 2,3,4...
In striping, uniform access to the data is assumed. If the stripe size is too large, then a hot spot may appear on one disk or on a small number of disks. Avoid this by reducing the stripe size, thus spreading the data over more disks.
Consider an example in which 100 rows of fixed size are evenly distributed over 5 disks, with each disk containing 20 sequential rows. If your application only requires access to rows 35 through 55, then only 2 disks must perform the I/O. At a high rate of concurrency, the system may not be able to achieve the desired level of performance.
Correct this problem by spreading rows 35 through 55 across more disks. In the current example, if there were two rows per block, then we could place rows 35 and 36 on the same disk, and rows 37 and 38 on a different disk. Taking this approach, we could spread the data over all the disks and I/O throughput would improve.
Redundant arrays of inexpensive disks (RAID) configurations provide improved data reliability. However, I/O performance depends on which RAID configuration is implemented.
Below are the most widely used RAID configurations:
Optimal stripe size is a function of three things:
Striping is a good tool for balancing I/O across two or more disks in an array. However, keep in mind the following techniques:
When you create an object, such as a table or rollback segment, Oracle allocates space in the database for the data. This space is called a segment. If subsequent database operations cause the data volume to increase and exceed the space allocated, then Oracle extends the segment. Dynamic extension then reduces performance.
This section discusses:
Dynamic extension causes Oracle to execute SQL statements in addition to those SQL statements issued by user processes. These SQL statements are called recursive calls because Oracle issues these statements itself. Recursive calls are also generated by these activities:
Examine the RECURSIVE CALLS statistic through the dynamic performance view V$SYSSTAT. By default, this view is available only to user SYS and to users granted the SELECT ANY TABLE system privilege, such as SYSTEM. Use the following query to monitor this statistic over a period of time:
SELECT NAME, VALUE
FROM V$SYSSTAT
WHERE NAME = 'recursive calls';
Oracle responds with something similar to the following:
NAME                                                         VALUE
------------------------------------------------------- ----------
recursive calls                                             626681
If Oracle continues to make excessive recursive calls while your application is running, then determine whether these recursive calls are due to an activity, other than dynamic extension, that generates recursive calls. If you determine that the recursive calls are caused by dynamic extension, then reduce this extension by allocating larger extents.
Follow these steps to avoid dynamic extension:
Larger extents tend to benefit performance for the following reasons:
DB_FILE_MULTI_BLOCK_READ_COUNT.
However, because large extents require more contiguous blocks, Oracle may have difficulty finding enough contiguous space to store them. To determine whether to allocate only a few large extents or many small extents, evaluate the benefits and drawbacks of each in consideration of plans for the growth and use of your objects.
Automatically re-sizable datafiles can also cause problems with dynamic extension. Instead, manually allocate more space to a datafile during times when the system is relatively inactive.
Even though an object may have unlimited extents, this does not mean that having a large number of small extents is acceptable. For optimal performance you may decide to reduce the number of extents.
Extent maps list all extents for a particular segment. The number of extents entries per Oracle block depends on operating system block size and platform. Although an extent is a data structure inside Oracle, the size of this data structure depends on the platform. Accordingly, this affects the number of extents Oracle can store in a single operating system block. Typically, this value is as follows:
| Block Size (KB) | Maximum Number of Extents |
|
2 |
121 |
|
4 |
255 |
|
8 |
504 |
|
16 |
1032 |
|
32 |
2070 |
For optimal performance, you should be able to read the extent map with a single I/O. Performance degrades if multiple I/Os are necessary for a full table scan to get the extent map.
Avoid dynamic extension in dictionary-mapped tablespaces. For dictionary-mapped tablespaces, do not let the number of extents exceed 1,000. If extent allocation is local, then do not have more than 2,000 extents. Having too many extents reduces performance when dropping or truncating tables.
This section explains various ramifications of using multiple extents.
The size of rollback segments can affect performance. Rollback segment size is determined by the rollback segment's storage parameter values. Your rollback segments must be large enough to hold the rollback entries for your transactions. As with other objects, you should avoid dynamic space management in rollback segments.
Use the SET TRANSACTION statement to assign transactions to rollback segments of the appropriate size based on the recommendations in the following sections. If you do not explicitly assign a transaction to a rollback segment, then Oracle automatically assigns it to a rollback segment.
For example, the following statement assigns the current transaction to the rollback segment OLTP_13:
SET TRANSACTION USE ROLLBACK SEGMENT oltp_13
Also, monitor the shrinking, or dynamic deallocation, of rollback segments based on the OPTIMAL storage parameter.
|
See Also:
For information on choosing values for this parameter, monitoring rollback segment shrinking, and adjusting the |
Assign large rollback segments to transactions that modify data that is concurrently selected by long queries. Such queries may require access to rollback segments to reconstruct a read-consistent version of the modified data. The rollback segments must be large enough to hold all the rollback entries for the data while the query is running.
Assign large rollback segments to transactions that modify large amounts of data. A large rollback segment can improve the performance of such a transaction, because the transaction generates large rollback entries. If a rollback entry does not fit into a rollback segment, then Oracle extends the segment. Dynamic extension reduces performance and should be avoided whenever possible.
OLTP applications are characterized by frequent concurrent transactions, each of which modifies a small amount of data. Assign OLTP transactions to small rollback segments, provided that their data is not concurrently queried. Small rollback segments are more likely to remain stored in the buffer cache where they can be accessed quickly. A typical OLTP rollback segment might have 2 extents, each approximately 10 kilobytes in size. To best avoid contention, create many rollback segments and assign each transaction to its own rollback segment.
If an UPDATE statement increases the amount of data in a row so that the row no longer fits in its data block, then Oracle tries to find another block with enough free space to hold the entire row. If such a block is available, then Oracle moves the entire row to the new block. This is called migrating a row. If the row is too large to fit into any available block, then Oracle splits the row into multiple pieces and stores each piece in a separate block. This is called chaining a row. Rows can also be chained when they are inserted.
Dynamic space management, especially migration and chaining, is detrimental to performance:
UPDATE statements that cause migration and chaining perform poorly.
Identify migrated and chained rows in a table or cluster using the ANALYZE statement with the LIST CHAINED ROWS clause. This statement collects information about each migrated or chained row and places this information into a specified output table.
The definition of a sample output table named CHAINED_ROWS appears in a SQL script available on your distribution medium. The common name of this script is UTLCHN1.SQL, although its exact name and location varies depending on your platform. Your output table must have the same column names, datatypes, and sizes as the CHAINED_ROWS table.
You can also detect migrated or chained rows by checking the TABLE FETCH CONTINUED ROW column in V$SYSSTAT. Increase PCTFREE to avoid migrated rows. If you leave more free space available in the block, then the row has room to grow. You can also reorganize or re-create tables and indexes with high deletion rates.
To reduce migrated and chained rows in an existing table, follow these steps:
ANALYZE statement to collect information about migrated and chained rows. For example:
ANALYZE TABLE order_hist LIST CHAINED ROWS;
SELECT *
FROM CHAINED_ROWS
WHERE TABLE_NAME = 'ORDER_HIST';

OWNER_NAME  TABLE_NAME  CLUST... HEAD_ROWID          TIMESTAMP
----------  ----------  -----... ------------------  ---------
SCOTT       ORDER_HIST       ... AAAAluAAHAAAAA1AAA  04-MAR-96
SCOTT       ORDER_HIST       ... AAAAluAAHAAAAA1AAB  04-MAR-96
SCOTT       ORDER_HIST       ... AAAAluAAHAAAAA1AAC  04-MAR-96
The output lists all rows that are either migrated or chained.
CREATE TABLE int_order_hist
   AS SELECT *
      FROM order_hist
      WHERE ROWID IN
         (SELECT HEAD_ROWID
            FROM CHAINED_ROWS
            WHERE TABLE_NAME = 'ORDER_HIST');
DELETE FROM order_hist
   WHERE ROWID IN
      (SELECT HEAD_ROWID
         FROM CHAINED_ROWS
         WHERE TABLE_NAME = 'ORDER_HIST');
INSERT INTO order_hist
SELECT *
FROM int_order_hist;
DROP TABLE int_order_history;
DELETE FROM CHAINED_ROWS
WHERE TABLE_NAME = 'ORDER_HIST';
ANALYZE statement again and query the output table.
LONG column or long CHAR or VARCHAR2 columns.
Retrieval of migrated rows is resource intensive; therefore, all tables subject to UPDATE should have their distributed free space set to allow enough space within the block for the likely update.
The SQL.BSQ file runs when you issue the CREATE DATABASE statement. This file contains the table definitions that make up the Oracle server. The views you use as a DBA are based on these tables. Oracle recommends that you strictly limit modifications to SQL.BSQ.
INITIAL, NEXT, MINEXTENTS, MAXEXTENTS, PCTINCREASE, FREELISTS, FREELIST GROUPS, and OPTIMAL.
PCTINCREASE, do not decrease the setting of a storage parameter to a value below the default. (If the value of MAXEXTENTS is large, then you can lower the value for PCTINCREASE or even set it to zero.)
SQL.BSQ are supported. In particular, you should not add, drop, or rename a column.
A tablespace that manages its own extents maintains a bitmap in each datafile to keep track of the free or used status of blocks in that datafile. Each bit in the bitmap corresponds to a block or a group of blocks. When an extent is allocated or freed for reuse, Oracle changes the bitmap values to show the new status of the blocks. These changes do not generate rollback information, because they do not update tables in the data dictionary (except for special cases such as tablespace quota information).
Locally-managed tablespaces have the following advantages over dictionary-managed tablespaces:
The sizes of extents that are managed locally can be determined automatically by the system. Alternatively, all extents can have the same size in a locally-managed tablespace.
|
See Also:
For more information on locally-managed tablespaces, see Oracle8i Concepts and Oracle8i Administrator's Guide. For more information on the statements for specifying space management, see Oracle8i SQL Reference. |
There is a trade-off between performance and memory usage. For best performance, most sorts should occur in memory; sorts written to disk adversely affect performance. If the sort area size is too large, then too much memory may be used. If the sort area size is too small, then sorts may need to be written to disk which, as, mentioned, can severely degrade performance.
This section describes:
The default sort area size is adequate to hold all the data for most sorts. However, if your application often performs large sorts on data that does not fit into the sort area, then you may want to increase the sort area size. Large sorts can be caused by any SQL statement that performs a sort on many rows.
Oracle collects statistics that reflect sort activity and stores them in the dynamic performance view V$SYSSTAT. By default, this view is available only to the user SYS and to users granted the SELECT ANY TABLE system privilege. These statistics reflect sort behavior:
Use the following query to monitor these statistics over time:
SELECT NAME, VALUE
FROM V$SYSSTAT
WHERE NAME IN ('SORTS (MEMORY)', 'SORTS (DISK)');
The output of this query might look like this:
NAME                                                         VALUE
------------------------------------------------------- ----------
SORTS(MEMORY)                                                  965
SORTS(DISK)                                                      8
The information in V$SYSSTAT can also be obtained through the Simple Network Management Protocol (SNMP).
SORT_AREA_SIZE is a dynamically modifiable initialization parameter that specifies the maximum amount of memory to use for each sort. If a significant number of sorts require disk I/O to temporary segments, then your application's performance may benefit from increasing the size of the sort area. In this case, increase the value of SORT_AREA_SIZE.
The maximum value of this parameter depends on your operating system. You need to determine what size SORT_AREA_SIZE makes sense. If you set SORT_AREA_SIZE to an adequately large value, then most sorts should not need to go to disk (unless, for example, you are sorting a 10-gigabyte table).
|
See Also:
For more information, see the "Tuning Sort Areas" section in Chapter 19, "Tuning Memory Allocation". |
As mentioned, increasing sort area size decreases the chances that sorts go to disk. Therefore, with a larger sort area, most sorts process quickly without I/O.
When Oracle writes sort operations to disk, it writes out partially sorted data in sorted runs. After all the data has been received by the sort, Oracle merges the runs to produce the final sorted output. If the sort area is not large enough to merge all the runs at once, then subsets of the runs are merged in several merge passes. If the sort area is larger, then there are fewer, longer runs produced. A larger sort area also means the sort can merge more runs in one merge pass.
Increasing sort area size causes each Oracle sort process to allocate more memory. This increase reduces the amount of memory for private SQL and PL/SQL areas. It can also affect operating system memory allocation and may induce paging and swapping. Before increasing the size of the sort area, be sure enough free memory is available on your operating system to accommodate a larger sort area.
If you increase sort area size, then consider decreasing the value for the SORT_AREA_RETAINED_SIZE parameter. This parameter controls the lower limit to which Oracle reduces the size of the sort area when Oracle completes some or all of a sort process. That is, Oracle reduces the size of the sort area after the sort has started sending the sorted data to the user or to the next part of the query. A smaller retained sort area reduces memory usage but causes additional I/O to write and read data to and from temporary segments on disk.
Sort writes to disk directly bypass the buffer cache. If you sort to disk, then make sure that PCTINCREASE is set to zero for the tablespace used for sorting. Also, INITIAL and NEXT should be the same size. This reduces fragmentation of the tablespaces used for sorting. You set these parameters using the STORAGE clause of ALTER TABLE.
Optimize sort performance by performing sorts in temporary tablespaces. To create temporary tablespaces, use the CREATE TABLESPACE or ALTER TABLESPACE statements with the TEMPORARY keyword.
Normally, a sort may require many space allocation calls to allocate and deallocate temporary segments. If you specify a tablespace as TEMPORARY, then Oracle caches one sort segment in that tablespace for each instance requesting a sort operation. This scheme bypasses the normal space allocation mechanism and greatly improves performance of medium-sized sorts that cannot be done completely in memory.
You cannot use the TEMPORARY keyword with tablespaces containing permanent objects such as tables or rollback segments.
|
See Also:
For more information about the syntax of the |
Stripe the temporary tablespace over many disks, preferably using an operating system striping tool. For example, if you only stripe the temporary tablespace over 2 disks with a maximum of 50 I/Os per second on each disk, then Oracle can only perform 100 I/Os per second. This restriction could lengthen the duration of sort operations.
For the previous example, you could accelerate sort processing fivefold if you striped the temporary tablespace over 10 disks. This would enable 500 I/Os per second.
Another way to improve sort performance using temporary tablespaces is to tune the parameter SORT_MULTIBLOCK_READ_COUNT. For temporary segments, SORT_MULTIBLOCK_READ_COUNT has nearly the same effect as the parameter DB_FILE_MULTIBLOCK_READ_COUNT.
Increasing the value of SORT_MULTIBLOCK_READ_COUNT forces the sort process to read a larger section of each sort run from disk to memory during each merge pass. This also forces the sort process to reduce the merge width, or number of runs, that can be merged in one merge pass. This may increase in the number of merge passes.
Because each merge pass produces a new sort run to disk, an increase in the number of merge passes causes an increase in the total amount of I/O performed during the sort. Carefully balance increases in I/O throughput obtained by increasing the SORT_MULTIBLOCK_READ_COUNT parameter with possible increases in the total amount of I/O performed.
One cause of sorting is the creation of indexes. Creating an index for a table involves sorting all rows in the table based on the values of the indexed columns. Oracle also allows you to create indexes without sorting. If the rows in the table are loaded in ascending order, then you can create the index faster without sorting.
To create an index without sorting, load the rows into the table in ascending order of the indexed column values. Your operating system may provide a sorting utility to sort the rows before you load them. When you create the index, use the NOSORT clause on the CREATE INDEX statement. For example, this CREATE INDEX statement creates the index EMP_INDEX on the ENAME column of the emp table without sorting the rows in the EMP table:
CREATE INDEX emp_index
   ON emp(ename)
   NOSORT;
Presorting your data and loading it in order may not always be the fastest way to load a table.
NOSORT clause.
NOSORT clause.
Sorting can be avoided when performing a GROUP BY operation when you know that the input data is already ordered, so that all rows in each group are clumped together. This may be the case if the rows are being retrieved from an index that matches the grouped columns, or if a sort-merge join produces the rows in the right order. ORDER BY sorts can be avoided in the same circumstances. When no sort takes place, the EXPLAIN PLAN output indicates GROUP BY NOSORT.
Checkpointing is an operation that Oracle performs automatically. This section explains the following:
Aggressive checkpointing will write dirty buffers to the datafiles more quickly and can reduce instance recovery time in the event of an instance failure. If checkpointing is fairly aggressive, then replaying the redo records in the redo log between the current checkpoint position and the end of the log involves processing relatively few data blocks. This means that the roll-forward phase of recovery will be fairly short.
However, aggressive checkpointing can reduce run-time performance, because checkpointing causes DBWn processes to perform I/O. The overhead associated with checkpointing is usually small.
Adjust your checkpointing activity based on your performance concerns. If you are more concerned with efficient run-time performance than recovery time, then set checkpointing to be less aggressive.
If you are more concerned with having fast instance recovery than with achieving optimal run-time performance, then increase the checkpointing interval.
Checkpointing behavior can be influenced by the following parameters:
LOG_CHECKPOINT_INTERVAL initialization parameter (in multiples of physical block size) to be larger than the size of your largest redo log file.
LOG_CHECKPOINT_TIMEOUT initialization parameter to zero. This value eliminates time-based checkpoints.
FAST_START_IO_TARGET to zero to disable fast-start checkpointing. This is described below under the heading, "Fast-Start Checkpointing".
In addition to setting these parameters, also consider the size of your log files. Maintaining small log files can increase checkpoint activity and reduce performance.
The fast-start checkpointing feature limits the number of dirty buffers and thereby limits the amount of time required for instance recovery. If Oracle must process an excessive number of I/O operations to perform instance recovery, then performance can be adversely affected. You can control this overhead by setting an appropriate value for the parameter FAST_START_IO_TARGET.
FAST_START_IO_TARGET limits the number of I/O operations that Oracle should allow for instance recovery. If the number of operations required for recovery at any point in time exceeds this limit, then Oracle writes dirty buffers to disk until the number of I/O operations needed for instance recovery is reduced to the limit set by FAST_START_IO_TARGET.
You can control the duration of instance recovery, because the number of operations required to recover indicates how much time this process takes. Disable this aspect of checkpointing by setting FAST_START_IO_TARGET to zero (0).
|
See Also:
For more information on the |
This section describes how to tune I/O for the log writer and database writer background processes.
Applications with many INSERTs or with LONG/RAW activity may benefit from tuning LGWR I/O. The size of each I/O write depends on the size of the log buffer which is set by the initialization parameter LOG_BUFFER. Therefore, it is important to choose the right log buffer size. LGWR starts writing if the buffer is one third full, or when it is posted by a foreground process such as a COMMIT. Too large a log buffer size might delay the writes. Too small a log buffer might also be inefficient, resulting in frequent, small I/Os.
If the average size of the I/O becomes quite large, then the log file could become a bottleneck. To avoid this problem, you can stripe the redo log files, going in parallel to several disks. You must use an operating system striping tool, because manual striping is not possible in this situation.
Stripe size is also important. You can figure an appropriate value by dividing the average redo I/O size by the number of disks over which you want to stripe the buffer.
Review V$SYSSTAT or the UTLBSTAT report for the following:
For example:
SELECT a.VALUE / DECODE(b.VALUE, 0, 1, b.VALUE)
FROM V$SYSSTAT a, V$SYSSTAT b
WHERE a.NAME = 'redo size' AND b.NAME = 'user commits';
This provides the average number redo records per commit. Now you must determine the average number of commits per second and multiply it by the average number redo records per commit (calculated above). This provides the max log buffers to setup.
The following events uniquely identify the specific wait:
Pre-Oracle 7.3 tuning required the following to tune log file switch counts:
This section describes the following issues of tuning DBWR I/O:
Multiple database writer processes are useful when a buffer cache is so large that one DBWn process running full-time cannot keep up with the load. However, for large transaction rate systems that have many CPUs, you can enable multiple database writers to handle the load.
Using the DB_WRITER_PROCESSES initialization parameter, you can create multiple database writer processes (from DBW0 to DBW9). Database I/O slaves provide non-blocking, asynchronous requests to simulate asynchronous I/O.
I/O slaves for DBWR are allocated immediately following database open, when the first I/O request is made. The DBWR continues to do all the DBWR-related work (scanning LRU). When the DBWR process initiates the I/O, the DBWR I/O slave simply does the I/O on behalf of DBWR. The writing of the batch is parallelized between the I/O slaves.
The main DBWR process, which is I/O issuing process, looks for an idle I/O slave. If one is available, then that I/O slave gets a post. If there are no idle slaves, then the I/O issuer spawns one. If the allowed number of slaves have been spawned, then the issuer waits and tries again to find an idle slave.
If the asynchronous I/O code of the platform has bugs or is not efficient, then asynchronous I/O can be disabled on a device type. However, multiple I/O slaves only parallelize the writing of the batch between the DBWR I/O slaves. In contrast, you can parallelize the gathering as well as the writing of buffers with the multiple DBWR feature. Therefore, from the throughput standpoint, N DBWR processes should deliver more throughput than one DBWR process with the same number of I/O slaves.
Multiple writer processes (and I/O slaves) are advanced features that are intended for heavy OLTP processing. Implement this feature only if the database environment requires such I/O throughput. For example, if asynchronous I/O is available, then it may be wise to disable I/O slaves and run with a single DBWR in asynchronous I/O mode.
|
Note: Review the current throughput, and examine possible bottlenecks to determine if it is feasible to implement these features. |
If it is determined that there is a need for multiple writer processes or slave processes, then determine which option to use. Although both implementations of DBWR processes may be beneficial, the general indicator rule on which option to use depends on the availability of asynchronous I/O (from the operating system) and the number of CPUs.
The number of CPUs is also indirectly related to the number LRU latch sets. To determine whether to use multiple DBWn processes or database slaves, follow these guidelines:
V$SYSTEM_EVENT view for significant numbers of 'free buffer' waits. Large values may indicate that users wants to read a buffer, but they cannot because there are too many dirty buffers in the cache. If you do not see free buffer waits, then DBWR is not a problem.
DB_WRITER_PROCESSES) when one DBWR cannot keep up. This is generally only necessary for large SMP systems with a lot of I/O activity. Typically, there should be no more than one DBWR for every 8 CPUs. Some systems can use multiple DBWR processes with asynchronous I/O enabled if they have very high transaction rates, are not CPU starved, and the operating system's async I/O works effectively.
Database writer (DBWn) processes use the internal write batch size, which is set to the lowest of the following three values (A, B, or C):

DB_BLOCK_BUFFERS.
Setting the internal write batch size too large may result in uneven response times.
For best results, you can influence the internal write batch size by changing the parameter values by which Value A is calculated. Take the following approach:
When you have multiple database writer DBWn processes and only one buffer pool, the buffer cache is divided up among the processes by LRU (least recently used) latches; each LRU latch is for one LRU list.
The default value of the DB_BLOCK_LRU_LATCHES parameter is 50% of the number of CPUs in the system. You can adjust this value to be equal to, or a multiple of, the number of CPUs. The objective is to cause each DBWn process to have the same number of LRU lists, so that they have equivalent loads.
For example, if you have 2 database writer processes and 4 LRU lists (4 latches), then the DBWn processes obtain latches in a round-robin fashion. DBW0 obtains latch 1, DBW1 obtains latch 2, then DBW0 obtains latch 3 and DBW1 obtains latch 4. Similarly, if your system has 8 CPUs and 3 DBWn processes, then you should have 9 latches.
If you are using multiple buffer pools and multiple database writer (DBWn) processes, then the number of latches in each pool (DEFAULT, KEEP, and RECYCLE) should be equal to, or a multiple of, the number of processes. This is recommended so that each DBWn process is equally loaded.
Consider the example in Figure 20-3 where there are 3 DBWn processes and 2 latches for each of the 3 buffer pools, for a total of 6 latches. Each buffer pool would obtain a latch in round robin fashion.
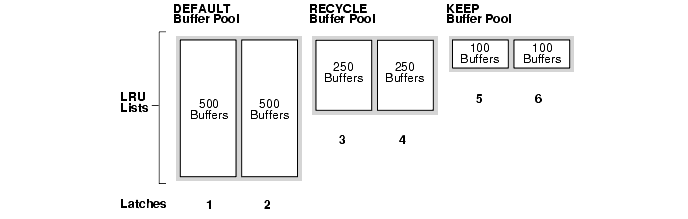
The DEFAULT buffer pool has 500 buffers for each LRU list. The RECYCLE buffer pool has 250 buffers for each LRU list. The KEEP buffer pool has 100 buffers for each LRU.
Thus, the load carried by each of the DBWn processes differs, and performance suffers. If, however, there are 3 latches in each pool, then the DBWn processes have equal loads, and performance is optimized.
The different buffer pools have different rates of block replacement. Ordinarily, blocks are rarely modified in the KEEP pool and frequently modified in the RECYCLE pool. This means that you need to write out blocks more frequently from the RECYCLE pool than from the KEEP pool. As a result, owning 100 buffers from one pool is not the same as owning 100 buffers from the other pool. To be perfectly load balanced, each DBWn process should have the same number of LRU lists from each type of buffer pool.
A well-configured system might have 3 DBWn processes and 9 latches, with 3 latches in each buffer pool.
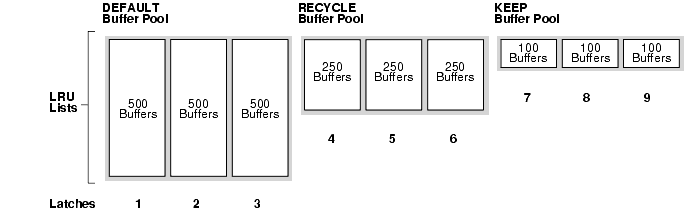
The DEFAULT buffer pool has 500 buffers for each LRU list. The RECYCLE buffer pool has 250 buffers for each LRU list. The KEEP buffer pool has 100 buffers for each LRU list.
The primary goal of backup and restore tuning is to create an adequate flow of data between disk and storage device. Tuning backup and restore operations involve the following tasks:
Backups and restore operations have three distinct components:
It is unlikely that all three of these perform at the same speed. Therefore, the slowest of these components is the bottleneck.
Oracle backup and restore uses two types of I/O: disk and tape. When performing a backup, the input files are read using disk I/O, and the output backup file is written using either disk or tape I/O. When performing restores, these roles reverse. Both disk and tape I/O can be synchronous or asynchronous; each is independent of the other.
When using synchronous I/O, you can easily determine how much time backup jobs require, because devices only perform one I/O task at a time. When using asynchronous I/O, it is more difficult to measure the bytes-per-second rate for the following reasons:
Recovery Manager (RMAN) is an Oracle tool that allows you to back up, copy, restore, and recover datafiles, control files, and archived redo logs. You can invoke RMAN as a command-line utility from the operating system prompt or use the GUI-based Enterprise Manager Backup Manager.
RMAN automates many of the backup and recovery tasks that were formerly performed manually. For example, instead of requiring you to locate appropriate backups for each datafile, copy them to the correct place using operating system commands, and choose which archived logs to apply, RMAN manages all these tasks automatically.
RMAN provides several parameters that allow you to tune backup and recovery operations. These are discussed in the following sections.
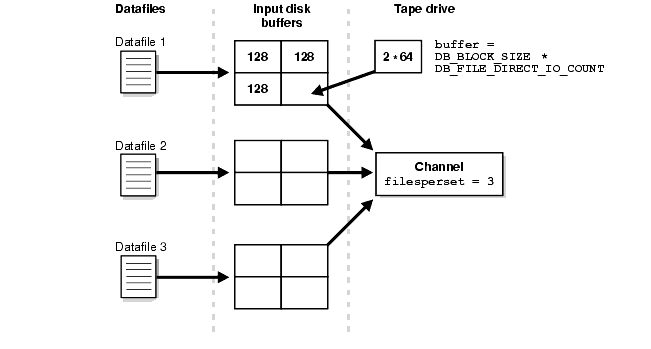
There are two different buffers: disk buffers and tape buffers. They can be different sizes. When RMAN backs up from disk, it allocates four disk buffers for each input datafile. You cannot alter the number of buffers that RMAN allocates.
The size of the disk buffers is controlled by the DB_FILE_DIRECT_IO_COUNT initialization parameter. This is the number of blocks per buffer. The default is 64.
The size of each buffer is equal to the product of the following initialization parameters:
DB_BLOCK_SIZE * DB_FILE_DIRECT_IO_COUNT
For example, if DB_BLOCK_SIZE = 2048 and DB_FILE_DIRECT_IO_COUNT =64, then each disk buffer is 128K. In this example, the total size of the buffers for each datafile is 128K * 4, or 512K. There are 4 buffers allocated for each datafile in the backup set.
If you want to know the total size of the buffers allocated in your backup, then multiply this total by the number of datafiles being accessed by the channel, and then multiply by the number of channels. You should also add a little extra to account for the control structures.
You can reduce the size of the buffers by lowering DB_FILE_DIRECT_IO_COUNT, but the number of buffers remains at 4 per file.
Oracle allocates 4 buffers per channel for the tape writers (or reads if doing a restore). There are usually 64K each. Therefore, to size this, multiply by 4, and then multiply by the number of channels.
You can change the size of each tape buffer using the parms parameter of the ALLOCATE CHANNEL statement. Set blksize to the desired size of each buffer. For example:
allocate channel foo type 'sbt_tape' parms="blksize=16384"
RMAN allocates the tape buffers in the SGA or the PGA. If you set the initialization parameter BACKUP_TAPE_IO_SLAVES = true, then RMAN allocates them from the SGA. If you set the parameter to FALSE, then RMAN allocates the buffers in the PGA.
If you use I/O slaves, then you should use the LARGE_POOL_SIZE initialization parameter to set aside some SGA memory that is dedicated to holding these large memory allocations. Hence, the RMAN I/O buffers do not compete with the library cache for SGA memory.

When RMAN reads or writes data, the action is either synchronous or asynchronous. When the I/O is synchronous, a server process can perform only one task at a time. When the I/O is asynchronous, a server process can begin one task, and other processes can perform other tasks while the initial process waits for the task to complete.
You can set initialization parameters that determine the type of I/O. If you set BACKUP_TAPE_IO_SLAVES to true, then the I/O is asynchronous. Otherwise, the I/O is synchronous.
Figure 20-7 illustrates synchronous I/O in a backup to tape. The following steps occur:
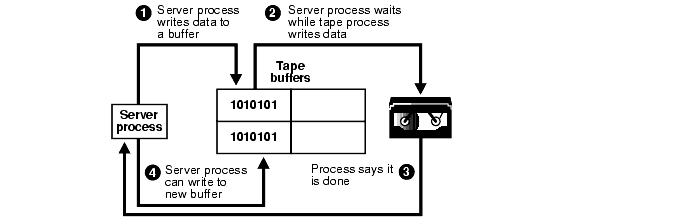
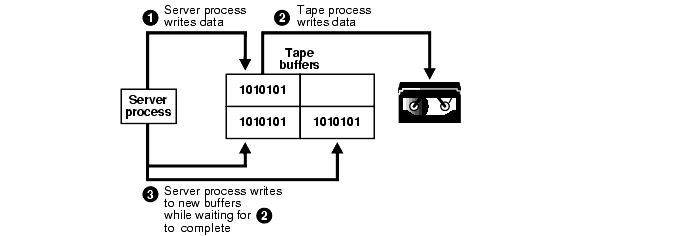
Figure 20-8 illustrates asynchronous I/O in a backup to tape. The following steps occur:
When you allocate a channel, RMAN lets you set various channel limit parameters that apply to operations performed by the allocated server session. You can use these parameters to do the following:
You can specify the following parameters:
|
See Also:
For syntax information on the |
The BACKUP statement lets you set parameters that influence how RMAN selects files for input into backup sets. You may need to set these parameter to do the following:
You can specify the following parameters:
|
See Also:
For syntax information on the |
An incremental backup is an RMAN backup in which only modified blocks are backed up. Incremental backups are not necessarily faster than full backups, because Oracle still reads the entire datafile to take an incremental backup. If tape drives are locally attached, then incremental backups could be faster. You must consider how much bandwidth there is for reading the disks compared to the bandwidth for writing to the tapes. If tape bandwidth is limited compared to disk, then incremental backups could help.
In an incremental backup, if only a few blocks have changed, then you need to input many buffers from the datafile before you accumulate enough blocks to fill a buffer and write to tape. So, it is possible that the tape drive is not streaming. Streaming means that the tape drive is 100% busy. If a tape drive is not kept streaming, then it becomes inefficient, because after each write, the tape drive must stop and rewind a little bit.
If you use a large filesperset in the filesperset parameter, then you can scan many datafiles in parallel, the output buffers for the tape drive are filled quickly, and you can write them frequently enough to keep the tape drive streaming.
For an incremental backup, filesperset=50 might be a good number. But, for a full or incremental level=0 backup, filesperset should be smaller, such as 4 or 8.
To get the best performance for a backup, follow these suggestions:
BACKUP_TAPE_IO_SLAVES initialization parameter to TRUE.
BACKUP_TAPE_IO_SLAVES to TRUE, then the tape buffers are allocated from the SGA. Therefore, allocate a LARGE_POOL for them. You can control the buffer size with the parms clause on the allocate channel statement:
DB_FILE_DIRECT_IO_COUNT initialization parameter. Use the maxopenfiles parameter to control how many datafiles are opened simultaneously on each channel.
BACKUP_DISK_IO_SLAVES to 4. This spawns processes to read datafiles in parallel, simulating asynchronous I/O. In this case, the datafile buffers are allocated from the SGA. The default value for this parameter is 0, meaning I/O slaves are not used at all, and the buffers come from the process local memory, not the SGA.
FILESPERSET=MAXOPENFILES. Use a value of 10 to start, and raise this if the tape drive does not stream. BACKUP_DISK_IO_SLAVES may be necessary.
Use the V$BACKUP_SYNC_IO and V$BACKUP_ASYNC_IO views to determine the source of backup or restore bottlenecks and to determine the progress of backup jobs.
V$BACKUP_SYNC_IO contains rows when the I/O is synchronous to the process (or thread on some platforms) performing the backup. V$BACKUP_ASYNC_IO contains rows when the I/O is asynchronous. Asynchronous I/O is obtained either with I/O processes or because it is supported by the underlying operating system.
With synchronous I/O, it is difficult to identify specific bottlenecks, because all synchronous I/O is a bottleneck to the process. The only way to tune synchronous I/O is to compare the bytes-per-second rate with the device's maximum throughput rate. If the bytes-per-second rate is lower than that device specifies, then consider tuning that part of the backup/restore process. Use the DISCRETE_BYTES_PER_SECOND column in the V$BACKUP_SYNC_IO view to see the I/O rate.
If the combination of LONG_WAITS and SHORT_WAITS is a significant fraction of IO_COUNT, then the file indicated in V$BACKUP_SYNCH_IO and V$BACKUP_ASYNCH_IO is probably a bottleneck. Some platforms' implementation of asynchronous I/O can cause the caller to wait for I/O completion when performing a non-blocking poll for I/O. Because this behavior can vary among platforms, the V$BACKUP_ASYNC_IO view shows the total time for both "short" and "long" waits.
Long waits are the number of times the backup/restore process told the operating system to wait until an I/O was complete. Short waits are the number of times the backup/restore process made an operating system call to poll for I/O completion in a non-blocking mode. Both types of waits the operating system should respond immediately.
If the SHORT_WAIT_TIME_TOTAL column is equal to or greater than the LONG_WAIT_TIME_TOTAL column, then your platform probably blocks for I/O completion when performing non-blocking I/O polling. In this case, the SHORT_WAIT_TIME_TOTAL represents real I/O time for this file. If the SHORT_WAIT_TIME_TOTAL is low compared to the total time for this file, then the delay is most likely caused by other factors, such as process swapping. If possible, tune your operating system so that the I/O wait time appears up in the LONG_WAIT_TIME_TOTAL column.
Table 20-17 lists columns and their descriptions that are common to the V$BACKUP_SYNC_IO and V$BACKUP_ASYNC_IO views.
Table 20-18 lists columns specific to the V$BACKUP_SYNC_IO view.
Table 20-19 lists columns specific to the V$BACKUP_ASYNC_IO view.
In optimally tuned backups, tape components should create the only bottleneck. You should keep the tape and its device streaming, or constantly rotating. If the tape is not streaming, then the data flow to the tape may be inadequate.
This section contains the following topics to maintain streaming by improving backup throughput:
The rate at which the host sends data to keep the tape streaming depends on the following factors:
Tape device raw capacity is the smallest amount of data required to keep the tape streaming.
Compression is implemented either in the tape hardware or by the media management software. If you do not use compression, then the raw capacity of the tape device keeps it streaming. If you use compression, then the amount of data that must be sent to stream the tape is the raw device capacity multiplied by the compression factor. The compression factor varies for different types of data.
To determine whether your tape is streaming when the I/O is synchronous, query the EFFECTIVE_BYTES_PER_SECOND column in the V$BACKUP_SYNC_IO view.
If the I/O is asynchronous, then the tape is streaming if the combination of LONG_WAITS and SHORT_WAITS is a significant fraction of I/O count. Place more importance on SHORT_WAITS if the time indicated in the SHORT_WAIT_TIME_TOTAL column is equal to or greater than the LONG_WAIT_TIME_TOTAL column.
If the tape is not streaming, then the basic strategy is to supply more bytes-per-second to the tape. Modify this strategy depending on the how many blocks Oracle must read from disk and how many disks Oracle must access.
Using the DISKRATIO parameter of the BACKUP statement to distribute backup I/O across multiple volumes, specify how many disk drives RMAN uses to distribute file reads when backing up multiple concurrent datafiles. For example, assume that your system uses 10 disks. The disks supply data at 10 byes per second, and the tape drive requires 50 bytes per second to keep streaming. In this case, set DISKRATIO to 5 to spread the backup load onto 5 disks.
When setting DISKRATIO, spread the I/O over only as many disks as needed to keep the tape streaming: any more can increase the time it takes to recover a single file and provides no performance benefit. If you do not specify DISKRATIO, but you do specify FILESPERSET, then DISKRATIO defaults to FILESPERSET. If neither is specified, then DISKRATIO defaults to 4.
When performing a full backup of files that are largely empty, or when performing an incremental backup when few blocks have changed, you may not be able to supply data to the tape fast enough to keep it streaming.
In this case, you can achieve optimal performance by the following:
MAXOPENFILES parameter of the Recovery Manager SET LIMIT CHANNEL statement.
For more information about the
See Also:
RMAN SET statement, see Oracle8i Backup and Recovery Guide.
When you perform a full backup of files that are mostly full and the tape is not streaming, you can improve performance in several ways, as shown in Table 20-21:
You can optionally configure the large pool so that Oracle has a separate pool from which it can request large memory allocations. This prevents competition with other subsystems for the same memory.
As Oracle allocates more shared pool memory for the multi-threaded server session memory, the amount of shared pool memory available for the shared SQL cache decreases. If you allocate session memory from another area of shared memory, then Oracle can use the shared pool primarily for caching shared SQL and not incur the performance overhead from shrinking the shared SQL cache.
For I/O server processes and backup and restore operations, Oracle allocates buffers that are a few hundred kilobytes in size. Although the shared pool may be unable to satisfy this request, the large pool is able to do so. The large pool does not have an LRU list; Oracle does not attempt to age memory out of the large pool.
Use the LARGE_POOL_SIZE parameter to configure the large pool. To see in which pool (shared pool or large pool) the memory for an object resides, see the column POOL in V$SGASTAT.
|
See Also:
For more information about the large pool, see Oracle8i Concepts. For complete information about initialization parameters, see Oracle8i Reference. |
|
|
 Copyright © 1996-2000, Oracle Corporation. All Rights Reserved. |
|